- SpectrumSpy gets integrated with SDR# (SDRsharp), allowing some ability to click into a signal from a broad scan.
- SpectrumSpy gets a plug-in architecture that will allow other developers to create new applications.
- Someone writes a Uniden Close Call equivalent, that can quickly pick out nearby signals (those that appear with a threshold (18 db?) above the adjacent noise floor. (I need to check, I think Uniden's Close Call is 18 dB.
- Ability to get data out of SpectrumSpy similar to rtl_power and rtl_power_fftw
The pictures. These really need to be seen at full screen to be appreciated. These are full screen from a 1920 x 1200 (16:10) monitor.

The first image is showing the full range of the R820T tuner in the Airspy from 25 Mhz up to around 1,900 Mhz. The top shows the spectrum view as you'd expect to see on an analyzer. The waterfall on the bottom is showing roughly 10 minutes of accumlated data.
Note: This is in a somewhat quiet RF environment. In other words, Not NYC! For test purposes I'm using a small hand-held whip antenna, about 6-8 inch. The gain is set pretty low.
One of the things I was looking for was how much background noise I have, and on what parts of the spectrum. Looks like there is are a couple of areas with some noise (520 mhz), 260-280 mhz, ...
Next are some screenshots that "zoom in", by reducing the scan range from the full scale using the choices from the menu, which are currently fixed. These might be editable in the XML config, but I didn't get there yet.
Next up, 1 Ghz. starting from 25 Mhz. so that means centered on 525 Mhz:
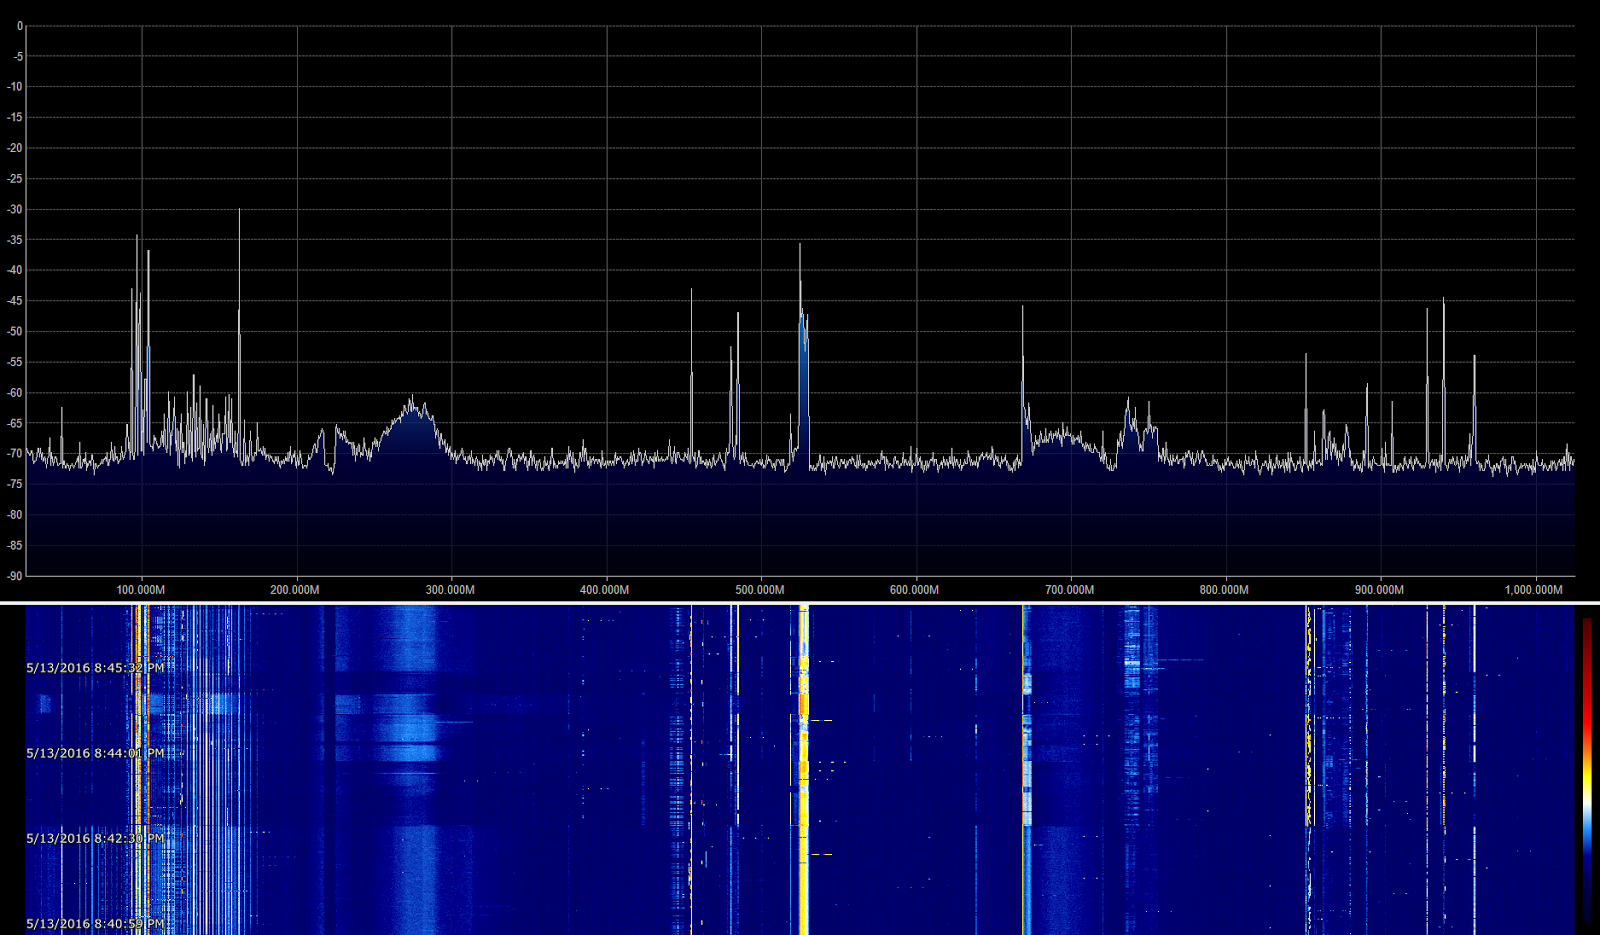
Thing to note:
- The waterfall shows approximately 5 minutes of data. The full bandwidth scan waterfall had nearly double that. The only factor I changed was the amount scanned. A 1 ghz scan completes in half the time of the full bandwidth approx 1.9 ghz scan.
- FM Broadcast between 88 Mhz and 2018 Mhz is easier to pick out.
- Problem areas where I'm picking up noise are more apparent.
- The noise at 520 Mhz isn't as constant as it looked.
- The wide scale changes in the waterfall are due to me holding the AirSpy. There are some shielding problems I need to look into. The AirSpy R2 has some fixes that my original AirSpy does not.
Now lets look at a 500 Mhz scan:

Things to note:
- Showing 500 Mhz, from 25 Mhz - 525 Mhz
- Note the noise that is generating evenly spaced lines in the 100 - 175 Mhz range. This is something I'll need to track down.
- One of the strong/constant signals that is visible is NOAA weather radio from Riverhead around 162 Mhz.
- I'm occasionally receiving air band transmissions around 120 Mhz.
- Around 440 - 450 Mhz, I'm either seeing a signal with an image, or I could be seeing repeater activity, on both the input and output frequencies.

Things to note:
- 200 Mhz, from 25 Mhz to 225 Mhz, (centered on 125 Mhz)
- waterfall now shows about 2 minutes, since the scan rate has more than doubled by going from 500 mhz to 200 mhz.
- The noise may start around 48 Mhz, and with harmonics/images roughly every 5-6 mhz.
Next, 100 Mhz scan:

Notes:
- Range 25 Mhz - 125 Mhz.
- Waterfall is covering 1.5 to 2 minutes, so scanning 100 mhz is happening pretty quickly.
- Main feature is the FM Broadcast band, 88 - 108 Mhz.
- Air band traffic visible around 123 Mhz.

Notes:
- 25 - 75 Mhz covered
- waterfall now covers only about 1 minute.
Next, 20 Mhz, showing the FM Broadcast band:

Notes:
- 88 - 108 Mhz. centered on 98 Mhz.
- It's easy to tell which are the strong FM stations in my area.
Lots more to play with. I have a SpyVerter up converter which will let me do < 30 Mhz, but it wasn't very interesting with only a short hand-held whip. Hopefully I'll have a chance with a random wire soon.
Please let me know what you'd like to see and any observations you have on these spectrum scans in the comments.
EDIT:
So, I'm happy that I'm able to upload these images to blogspot at full resolution. I need to figure out how to get blogspot to allow clickable thumbnail/full res. images. I'm going to try this over on Wordpress.com. I haven't done much with WordPress, but need to get some experience for a work project.
See the WordPress version of this point. Nicer looking but still no click to full-res version.

